US Dollar Index Outlook: Can Treasury Inflows Offset BoJ Intervention Risk
Weekly Report · 21 June 2026 · Hedge$Pro
Introduction
Over the past several weeks, I have been sharing market notes with Indian and global participants in the cotton industry, presenting detailed observations on ICE cotton futures and the US Dollar Index (DXY). Recent notes have highlighted the temporary divergence of ICE Cotton futures from the underlying supply-demand fundamentals of the cotton market, with cotton price movements increasingly influenced by changes in the DXY.
This note examines the key drivers of the DXY, and assesses the likely trajectory of the index from short-term, medium-term and long-term perspectives.
DXY: Drivers, Recent Trends, and Outlook
Figure 1: Daily chart of the US Dollar Index (DXY), illustrating the key phases in its recent price movements.
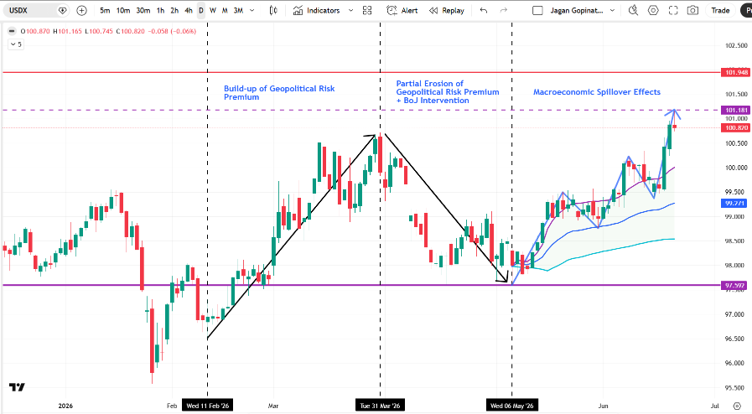
February – March’2026: Expansion of Geopolitical Risk Premium
- The 4.27% appreciation in the DXY can be broadly attributed to geopolitical risk premium (emanating from the West Asia conflict) being priced into the index.
March – May’2026: Correction Phase
- The easing and re-escalation of geopolitical tensions involving US, Israel, and Iran led to profit-taking by recently established dollar long positions.
- Japanese yen weakened beyond the level of 160 yen per US dollar - a level widely viewed as a threshold for possible intervention by the Bank of Japan (BoJ). The BoJ intervened in the foreign exchange market to the extent of approximately USD 75 billion to stabilize the yen.
- These developments contributed to a partial unwinding of dollar-yen carry trade positions, exerting downward pressure on the dollar index.
- As a result, the DXY corrected approximately 3.10% from the highs established on 31 March.
May 2026 Onwards: Emergence of a Bullish Trend
- In early May, the DXY rebounded from the mean reversion level of 97.592.
- Subsequent economic releases from the United States pointed to a tightening labour market. Higher-than-expected Consumer Price Index and Producer Price Index (year on year) readings increased the likelihood that inflationary pressures could persist for longer than previously anticipated.
- It is important to note that, since 6 May, each decline in the DXY has attracted buying interest. The index has so far rallied 3.64% from the strong support level of 97.592, consistently registering higher highs and higher lows. The price action increasingly exhibits characteristics associated with a developing bullish trend.
- The key question, therefore, is whether the recent price rally has been driven primarily by the short covering in the US dollar positions or by fresh long positioning supported by new capital entering the market.
- Analysis of open interest in DXY Futures provides useful insight. Open interest has increased steadily since 12 May, rising from 32,108 contracts to 53,590 contracts, representing an increase of approximately 67%.
- The evidence therefore suggests that the recent advance is not merely a short-covering rally, but an evolving bullish trend supported by fresh long positioning. This distinction is important, as rallies supported by fresh long positioning tend to be more durable than those driven solely by short covering.
Near-term Outlook for the Dollar Index
- From a technical perspective, the upward momentum in the DXY remains intact on both the weekly and daily charts, despite the US Federal Reserve leaving monetary policy unchanged at Kevin Warsh’s first meeting as chair of the US Fed.
- The fundamental driver behind this momentum appears to be the revised Fed dot plot. Nine out of eighteen Fed members indicated a preference for rate increases, compared with no members supporting a rate hike at the previous held meeting in March. The hawkish tilt by the Fed rests on two core observations – tighter job market and inflation at 4% and above target for five years. Investors anticipate 25 basis points hike by October and a higher probability for another 25 bp hike in early 2027. This shift in expectations has reinforced the bullish sentiment toward the US dollar in the near term.
- A significant development over the long weekend was the Israeli strikes in Lebanon and Iran’s subsequent announcement regarding the closure of the Strait of Hormuz on 20 June. This development may contribute to the re-emergence of a geo political risk premium in the US dollar and could provide additional support to the DXY in the very near term.
- The prevailing technical momentum may carry the index toward 101.948, where it is likely to encounter its first meaningful resistance level. Should the DXY bulls successfully breach this resistance, the next upside target is 104.614.
- However, one important risk to the bullish outlook warrants close attention: the possibility of intervention by the Bank of Japan following the continued weakening of the Japanese yen beyond the critical level of 160.000 yen per US dollar. The yen, with its latest settlement at 161.808, is approaching its recent two year low of 161.951 against the dollar.
Figure 2: Weekly chart of the Japanese Yen (JPY). The green ellipses highlight the previous episodes of intervention by the Bank of Japan in the currency market.
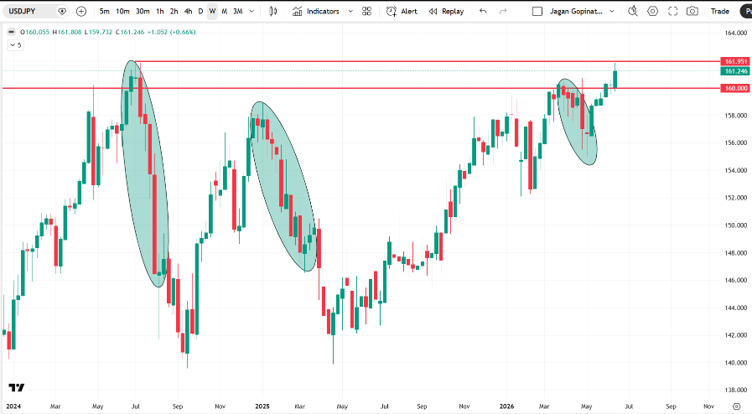
- At its latest policy meeting, the BoJ raised interest rate by 25 basis points to 1.0%. In addition, the BoJ decided to halt tapering from April 2027 and continue with purchase of Japanese government bonds at the pace of 2 trillion yen per month. Despite these measures, yen has failed to strengthen meaningfully.
Why is that so?
- The principal reason is the persistence of negative real rates in Japan. While the nominal policy rate stands at 1%, Japanese inflation measures range from 1.4% (core CPI) to 2.8% (preferred inflation gauge of BoJ), resulting in negative real yields. Consequently, borrowing in yen and investing in higher yielding dollar-denominated assets remains attractive, limiting the incentive to unwind dollar-yen carry trades.
- As a result, market participants increasingly anticipate the possibility of renewed BoJ intervention in the foreign exchange market. Should such intervention occur, it could trigger profit-taking in recently established long dollar positions, resulting in a correction from the latest settlement level of 100.820.
- Analysis of the DXY intra-day charts reveals the emergence of bearish candle stick patterns during the 05:30 - 13:30 IST trading window on 19 June, together with some moderation in upward momentum. This suggests that certain market participants may already be reducing long dollar exposure in anticipation of possible intervention by the BoJ.
- Assuming the DXY retraces from current levels, the next question concerns the extent of the potential correction. A back-of-the-envelope estimate of the average cost of long positions established since 6 May indicates an average entry level near 99.300. Coincidentally, the 50-day moving average currently stands at 99.325. The 99.30 +/- zone may therefore provide important support.
- The previously identified mean reversion level of 97.592 is likely to serve as a stronger support level should the correction extend further.
Medium-term Structural Conditions (3 months – 6 months’ time frame)
- Beyond the near-term developments listed above, several structural factors may continue to support the US dollar over the medium term.
- The United States continues to attract a disproportionate share of global capital flows into technology, artificial intelligence, and innovation-led businesses. The pipeline of technology company IPOs has the potential to attract substantial global investment flows into US equity markets. The recently concluded SpaceX IPO, which generated substantial investor interest, illustrates the ability of leading US innovation firms to attract global capital.
- At the same time, increasing US government support for strategic sectors such as semi-conductors, artificial intelligence, and advanced manufacturing reflects a broader policy objective of strengthening domestic technological leadership and industrial capabilities. Intel’s semi-conductor expansion projects, supported through grants and financing under the CHIPS and Science Act, demonstrate the strategic importance attached to domestic semi-conductor production and supply chain resilience.
- To the extent that global investors continue to view the United States as the principal destination for technological leadership and wealth creation, sustained capital flows into US equities and financial assets may continue to provide structural support to the US dollar.
Longer-term Outlook (12 months – 18 months’ time frame)
- At a first glance, though the US labour market conditions look tight enough to warranty rate hikes, do note that job creation is not an economy wide phenomenon. Rather it is concentrated in three sectors - private education and healthcare services, government, and leisure and hospitality. Unless the other sectors catch up, the odds for rate hike goes down over the longer-term horizon.
- If the US Iran ceasefire holds, gasoline prices in US will start going down to pre-war levels. Since the announcement of the MoU, the gasoline prices have already dropped down from the war high of 4.60 dollars per gallon to less than 4.0. This should ease the inflationary pressures in the US economy. If it does, the odds for rate hike goes down over the longer-term horizon.
Concluding Remarks
Near-term Outlook
- There is increasing probability for a healthy correction from the settlement level of 100.820 (19th June settlement).
- The anticipated downward correction is likely to be well supported at 99.300 level. This is because the upward momentum in the daily and weekly charts is still intact. We believe the dips in the DXY will be bought, and the DXY will once again push towards 101.948 followed by a move towards 104.000 if the dollar bears give in.
- The biggest risk for DXY bulls is the possibility for intervention by the Bank of Japan.
- Unless DXY breaks below the critical support level of 97.592, we cannot assume that bullish trend in DXY is changing into a bearish trend.
- The biggest risk for DXY bears is the resumption of hostility between US-Israel and Iran.
Medium-term Outlook
- DXY is likely to be well supported due to the US equity market dynamic.
Longer-term Outlook
- The odds for rate hike are likely to come down, if the US-Iran ceasefire holds.
Copyright
© 2026 Jagan Gopinath. All rights reserved. No part of this publication may be reproduced, distributed, or transmitted without prior written permission.
Disclaimer
This report is provided for informational and educational purposes only and does not constitute investment, trading, or financial advice. Readers are solely responsible for their decisions. Rainflo Consulting LLP, the platform provider Statoberry LLP and the author accept no liability for any loss arising from the use of this report.