Beyond the Bull Run: Decoding Gold Through an Integrated Lens
Tip: In print dialog choose “Save as PDF” · A4 portrait
Weekly Report · 29 March 2025 · Hedge$Pro
Introduction
Twenty-two years of navigating commodity markets - sourcing, trading, and managing risk across cycles of boom, crisis, and recovery - have a way of sharpening one’s instincts. But instincts alone are never enough. Over the years, I developed an integrated framework that brings together macroeconomic insight, fundamental drivers, structural market participation data, technical analysis outputs, and one more dimension into a single, coherent lens - for identifying high-conviction, risk-adjusted, alpha-generating opportunities across multiple asset classes - including commodities, equities, and currencies.
Since August 2025, we have been putting this framework to work for a select group of investors seeking to intelligently diversify their wealth portfolios. The results have been remarkable - and gold has been one of the most compelling stories.
The note you are about to read is a summary of the thesis that guided our investment recommendations in gold. It is also an introduction to the power of our framework itself - one that we are now further strengthening through a machine learning algorithm, developed in partnership with a group of statisticians, to make our decision-making sharper, and less susceptible to human bias.
Welcome to the beginning of our journey.
The Radiant Glitter
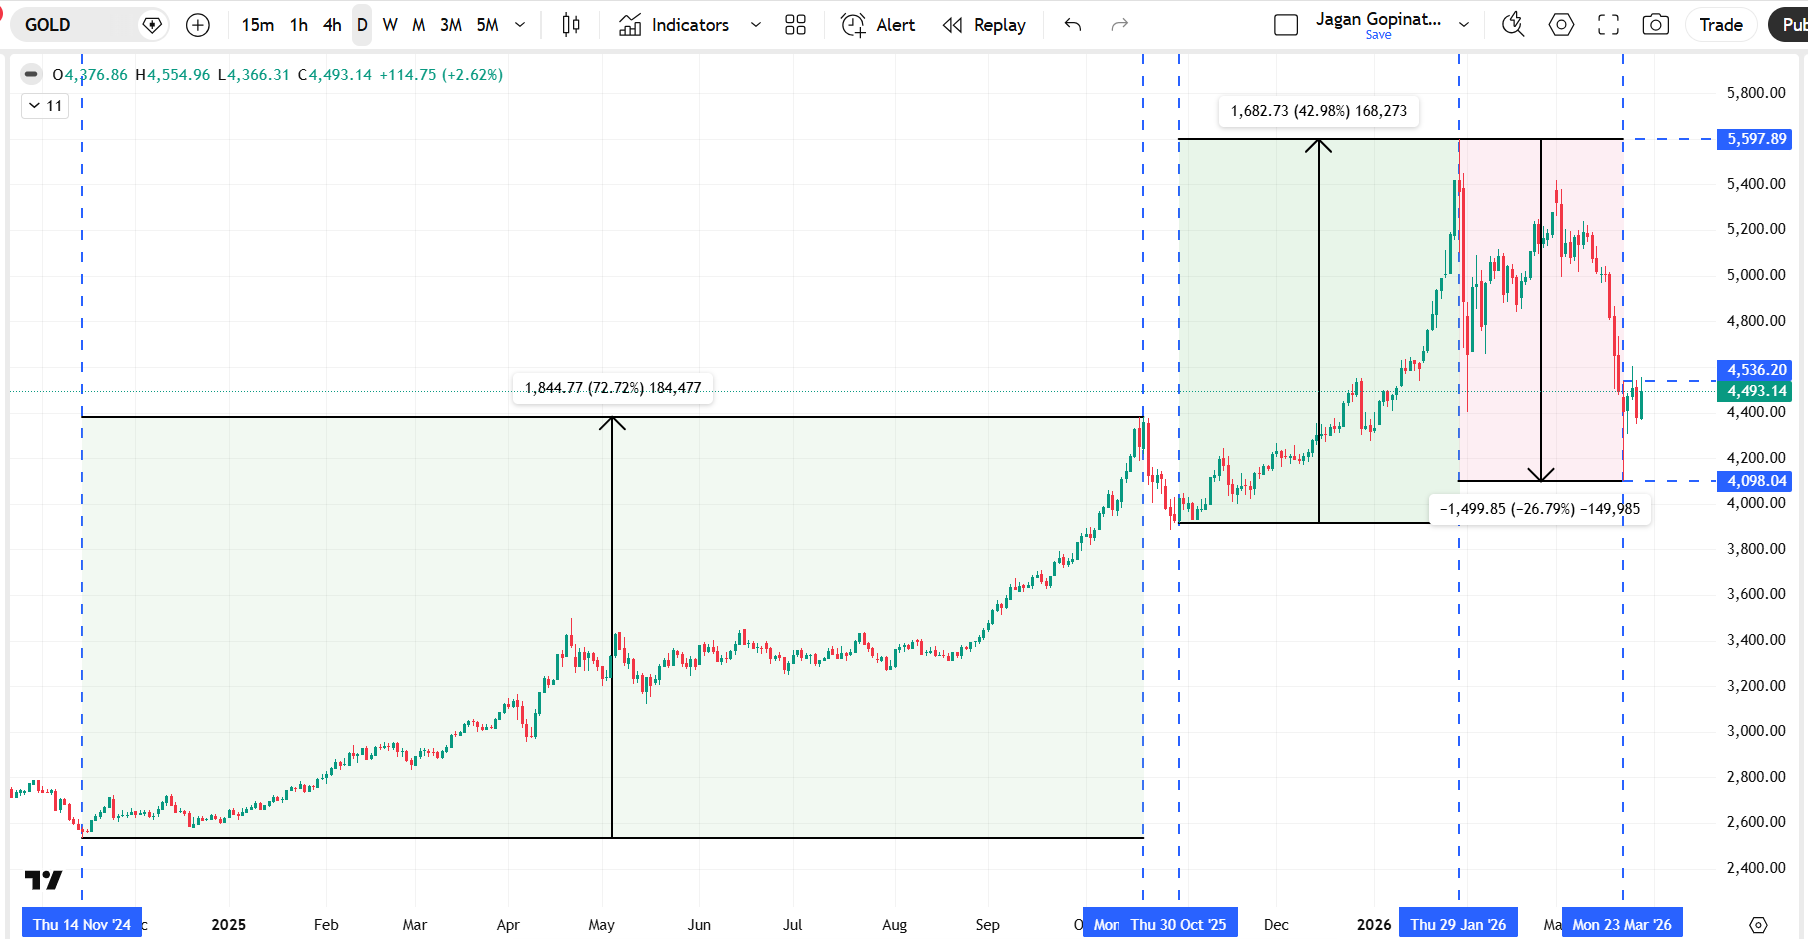
Gold’s performance since November 2024 has been nothing short of extraordinary. From a base of around $2,500 per ounce, the metal embarked on a powerful multi-phase bull run:
The first phase delivered a 72% surge between November 2024 and September 2025 - a move driven by a confluence of macroeconomic, structural, and technical forces. A brief but healthy consolidation followed in October 2025, resetting the stage for what came next.
The second phase was equally dramatic: a 42% rally between October 2025 and January 2026 that carried gold to an all-time high of $5,597 per ounce.
What followed was an equally instructive chapter - a 27% corrective pullback between January and March 2026, unfolding in a characteristic zigzag corrective pattern, that is consolidating sideways - pausing as it gathers energy for its next significant move.
The enclosed chart captures these phases visually, marking each leg with clarity.
Chart 1: Multi-phase bull run, Nov 2024 to Jan 2026 — followed by correction in Q1 of 2026
The Calm Before the Storm — April ’25 to August ’25
To truly appreciate how our framework works, we need to rewind to the 3rd week of April 2025.
Gold had just touched an all-time high of $3,400+ per ounce - the culmination of a breathtaking rally since mid-November 2024, fuelled by the powerful dollar debasement narrative.
Globally, gold is priced in US dollars per ounce. When the US dollar strengthens, demand for gold typically weakens, which causes its price to drop - and vice versa. This inverse relationship between the dollar and gold is a key factor behind fluctuations in gold prices. The ‘debasement trade’ refers to the practice followed by institutional investors who buy gold as a hedge against currency devaluation, especially when central banks expand the money supply (such as printing more money or lowering interest rates). During such times, gold becomes a safe-haven asset because it holds tangible value, unlike paper currencies that can lose their worth.
Refer the enclosed chart to understand the phenomenon of dollar debasement trade.
Chart 2: Gold vs US Dollar, 20th Jan 2025 till 22nd April 2025
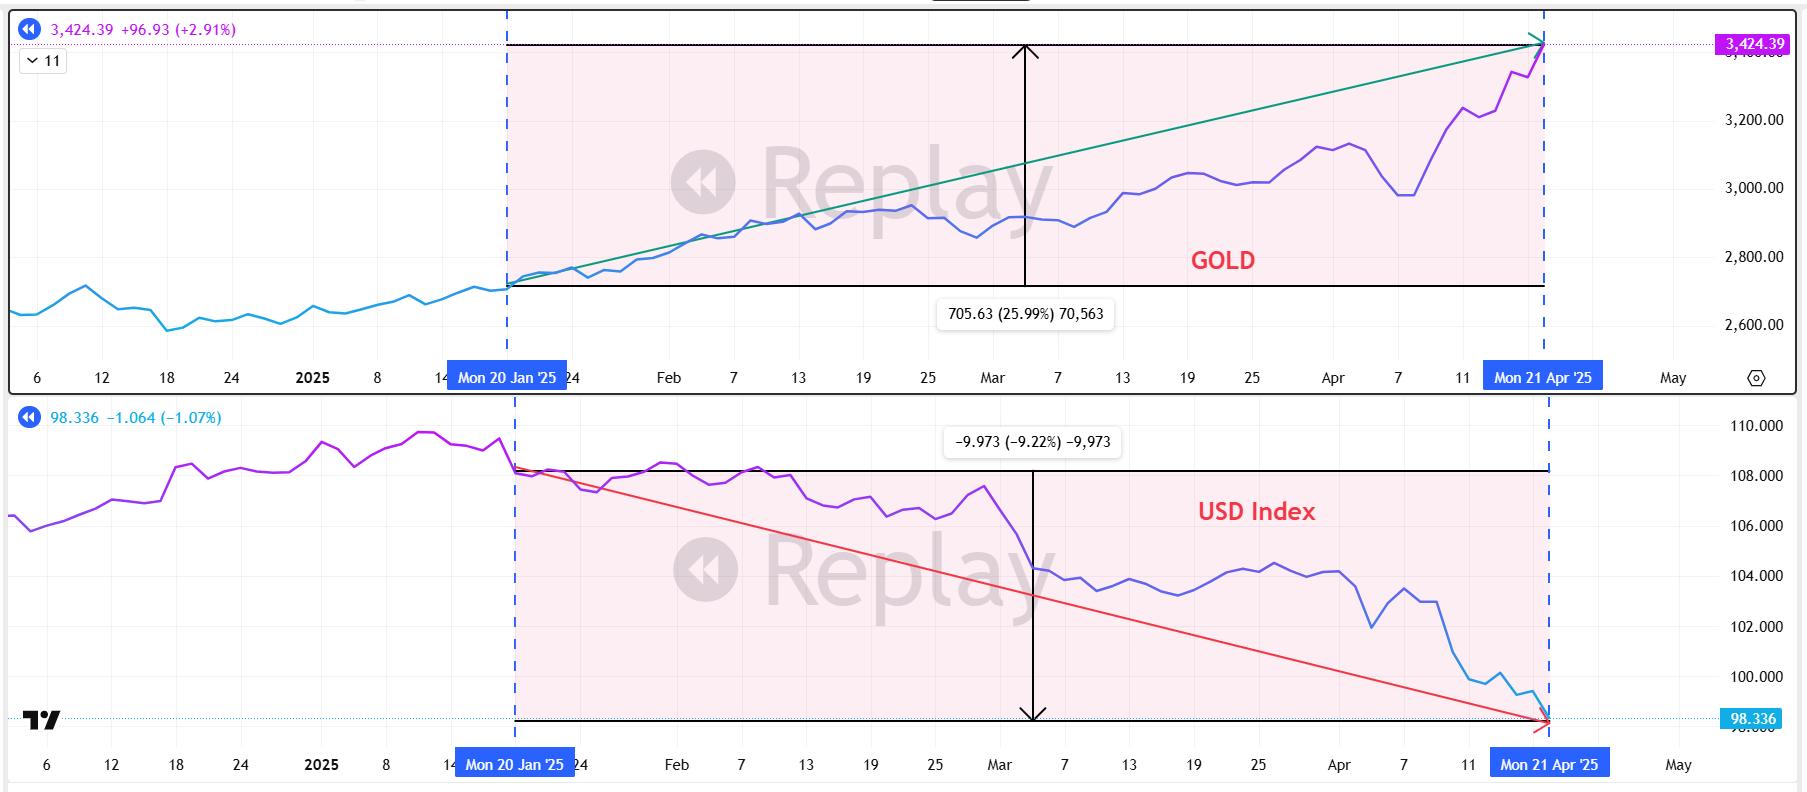
The upper pane shows gold prices since January 20, 2025, while the lower pane tracks the US Dollar Index over the same period.
Why is January 20, 2025, significant?
That’s the day Donald Trump’s administration was sworn in. Since then, the USD Index weakened by approximately 9%, driven by a combination of fiscal policies, attacks on the US Fed, as well as due to the aggressive trade war rhetoric by the Trump administration. When a global reserve currency like the US dollar “debases” (loses its purchasing power), the demand for gold typically rises, pushing up its price. Since January 20, 2025, gold surged by 26%, reaching an all-time high of US$ 3,425 per ounce.
Thus, as we headed into the 3rd week of April 2025, the mood in the market was euphoric. Commentators were confidently proclaiming that gold hitting $4,500 was just a few weeks away.
And then - instead of surging higher, gold moved sideways…
What followed was nearly four months of frustrating sideways price action, with the metal repeatedly failing to reclaim its April high. For investors who had entered the market after gold crossed $3,000 - lured in by the bullish noise and the headlines - this was a deeply disappointing experience. Forecasts were quietly revised downward. Portfolio allocations to gold were being trimmed. The consensus was shifting: perhaps gold had had its run.
Our integrated framework signalled a very different story.
What the Chart Was Telling Us
Between late April and mid-August, the gold price chart had quietly printed a textbook ‘converging triangle’ pattern - refer blue-coloured channel lines on the chart below. Characterised by a series of lower highs and higher lows, this pattern reflected a market in compression rather than downward retracement. Within this structure, a classic A-B-C-D-E sub-wave sequence (refer amber-coloured lines) was unfolding, with each sub-wave itself consisting of three smaller waves - a signature of organised, patterned market behaviour rather than random drift.
Chart 3: Converging triangle pattern — April ’25 to August ’25
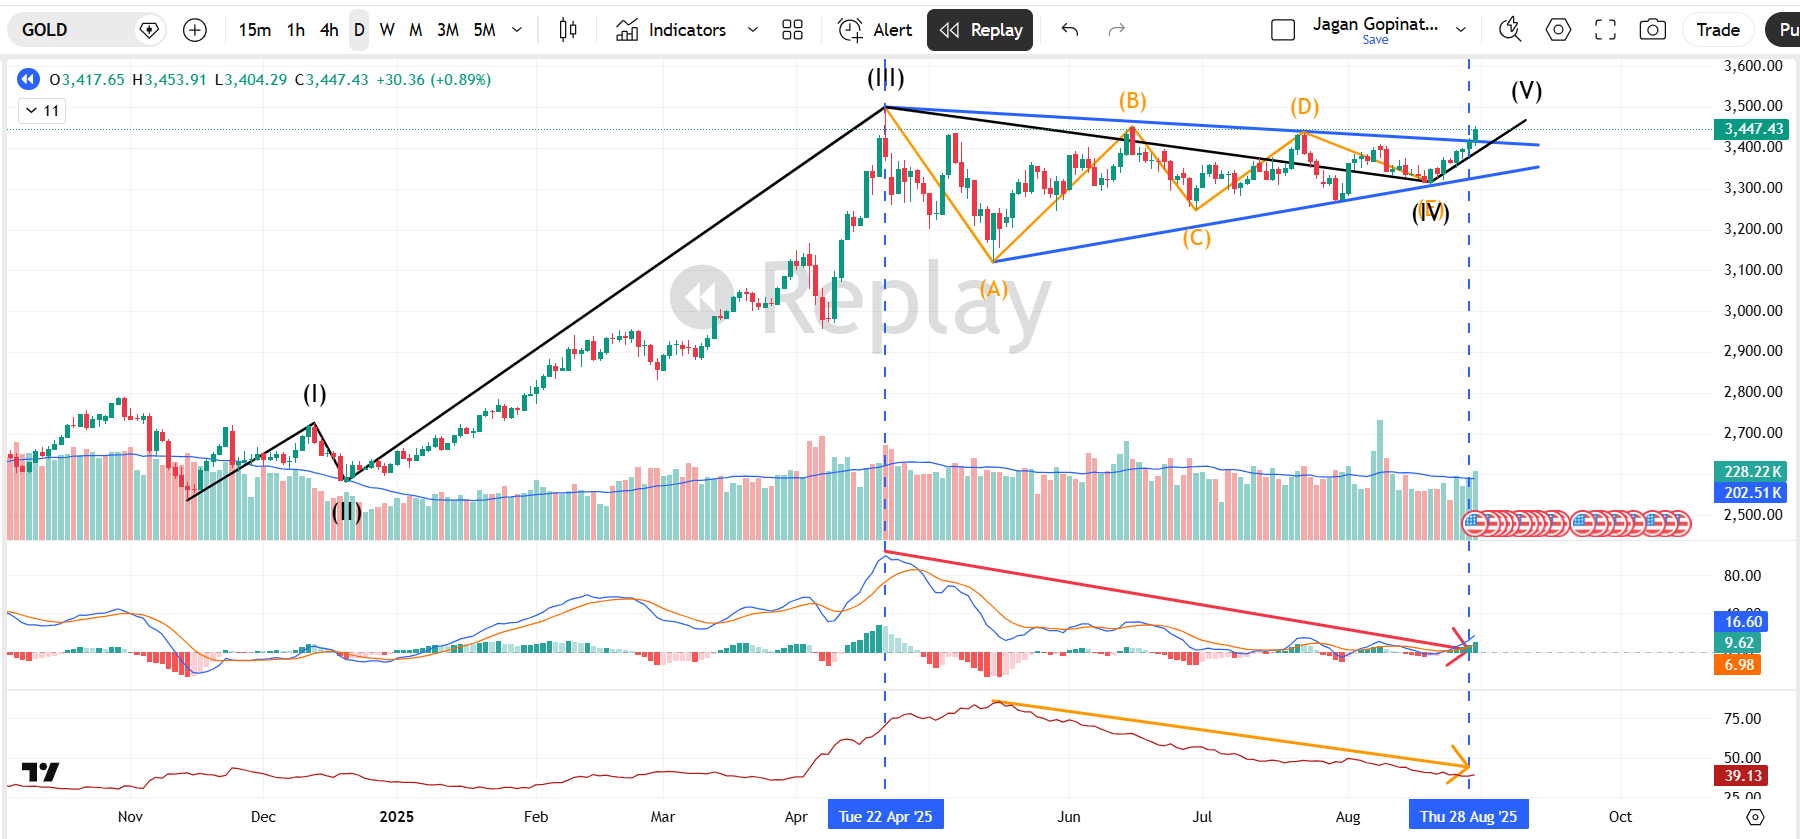
Accompanying this pattern were two equally important signals. Momentum was contracting - as highlighted by the downward-sloping red arrow on the chart - and so was volatility, indicated by the downward-sloping amber arrow.
In isolation, these signals might suggest a tired market.
But there was a crucial counterpoint: volume was not declining. The trading volumes during most sessions, when gold price was inside the converging triangle pattern, were crossing the 20-period moving average, meaning a significant number of contracts were changing hands every day - even as price went nowhere.
This combination is the market equivalent of a coiled spring. When price, momentum and volatility compress, while volume remains elevated, it signals an intense, ongoing contest between buyers and sellers - one that must eventually resolve with force in one direction. The more tightly the spring is coiled, the more powerful the eventual release.
The technical analysis component in our integrated framework therefore assigned a higher probability for a breakout above the upper channel - but we did not stop there. Our experience reminded us that relying on a single factor can lead to costly misjudgements.
Confirming the Signal Across Multiple Lenses
A breakout from a converging triangle can, on occasion, resolve to the downside. Therefore, what gave us the confidence to call the upside?
The answer lay in the convergence of signals across the other pillars of our framework.
Macroeconomic Signals
Significant pressure was building on the U.S. Federal Reserve to ease monetary policy, as Fed Chair Jerome Powell faced repeated and highly public challenges from the Trump administration.
Two notable developments occurred in August 2025. On August 8, Adriana Kugler resigned from the Federal Reserve Board - potentially opening the door to a more dovish appointee to the board.
Later that month, President Trump dismissed the head of the Bureau of Labor Statistics after alleging that he was “manipulating data for political purposes”, an event that coincided with a downward revision of 260,000 jobs in June’s employment figures.
Our machine learning model, which systematically analyses the tone and content of public statements and social media posts from key policymakers, registered a sustained escalation in negative sentiment toward the Federal Reserve during this period. The model tracks shifts in language - escalating criticism of monetary authorities, repeated calls for rate cuts, rhetoric that signals potential erosion of central bank independence - and encodes these signals into quantitative indicators. The output was clear: institutional pressure on the Fed was rising sharply, such pressure has been associated with a weakening US Dollar - a powerful tailwind for gold. The odds of a September rate cut were increasing.
Fundamental Signals
Gold demand is primarily driven by two actors - global central banks and physically backed gold ETFs (Exchange Traded Funds). By mid-2025, both were signalling strength.
For the first time since 1996, gold holdings as a percentage of foreign reserves held by central banks had surpassed their holdings of US Treasuries. China’s central bank had extended its gold-buying streak to a tenth consecutive month in August 2025, adding 1.9 tonnes to bring its total reserves to 2,302 tonnes. Central bank accumulation globally was accelerating - driven in large part by the escalating trade war rhetoric from the US administration, which was reinforcing gold’s appeal as a safe and sovereign reserve asset.
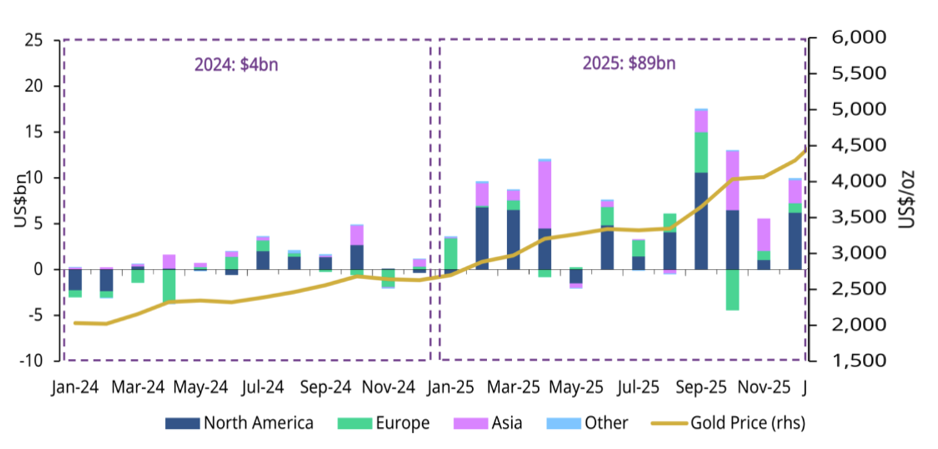
On the ETF front, cumulative inflows during the first half of 2025 were significantly above historical norms. After a brief pause in May, inflows had resumed strongly in June and continued to build momentum. The enclosed chart illustrates this trend.
Chart 4: Gold ETF inflow trends — in 2024 and 2025
What about the supply of gold?
The supply of gold is relatively inelastic because mine production, which contributes 75% of the global gold supply, cannot respond quickly to the demand-driven price changes. It takes time to explore new gold deposits and for new mines to enter production. The lagging of supply behind demand was scored as a fundamental factor supporting gold prices.
Structural Participation
The analysis of disaggregated futures and options positioning data provided the final piece of confirmation. Managed money funds - including the Commodity Trading Advisors (CTAs) - were re-entering the market with fresh long positions.
Between 26th August and 2nd September 2025, open interest in gold futures and options swelled by 131,500 contracts - a 21% increase - while managed money and other reportable positions increased their net long exposure by 34,701 contracts over the same period.
After analysing the positioning data trends, our model identified that the smart money was repositioning decisively for higher prices in gold.
When our multi-factor framework integrated and scored these signals (and a few other signals) together, the conclusion was unambiguous: this was a high-conviction long opportunity in gold, not a moment to hesitate.
The Outcome
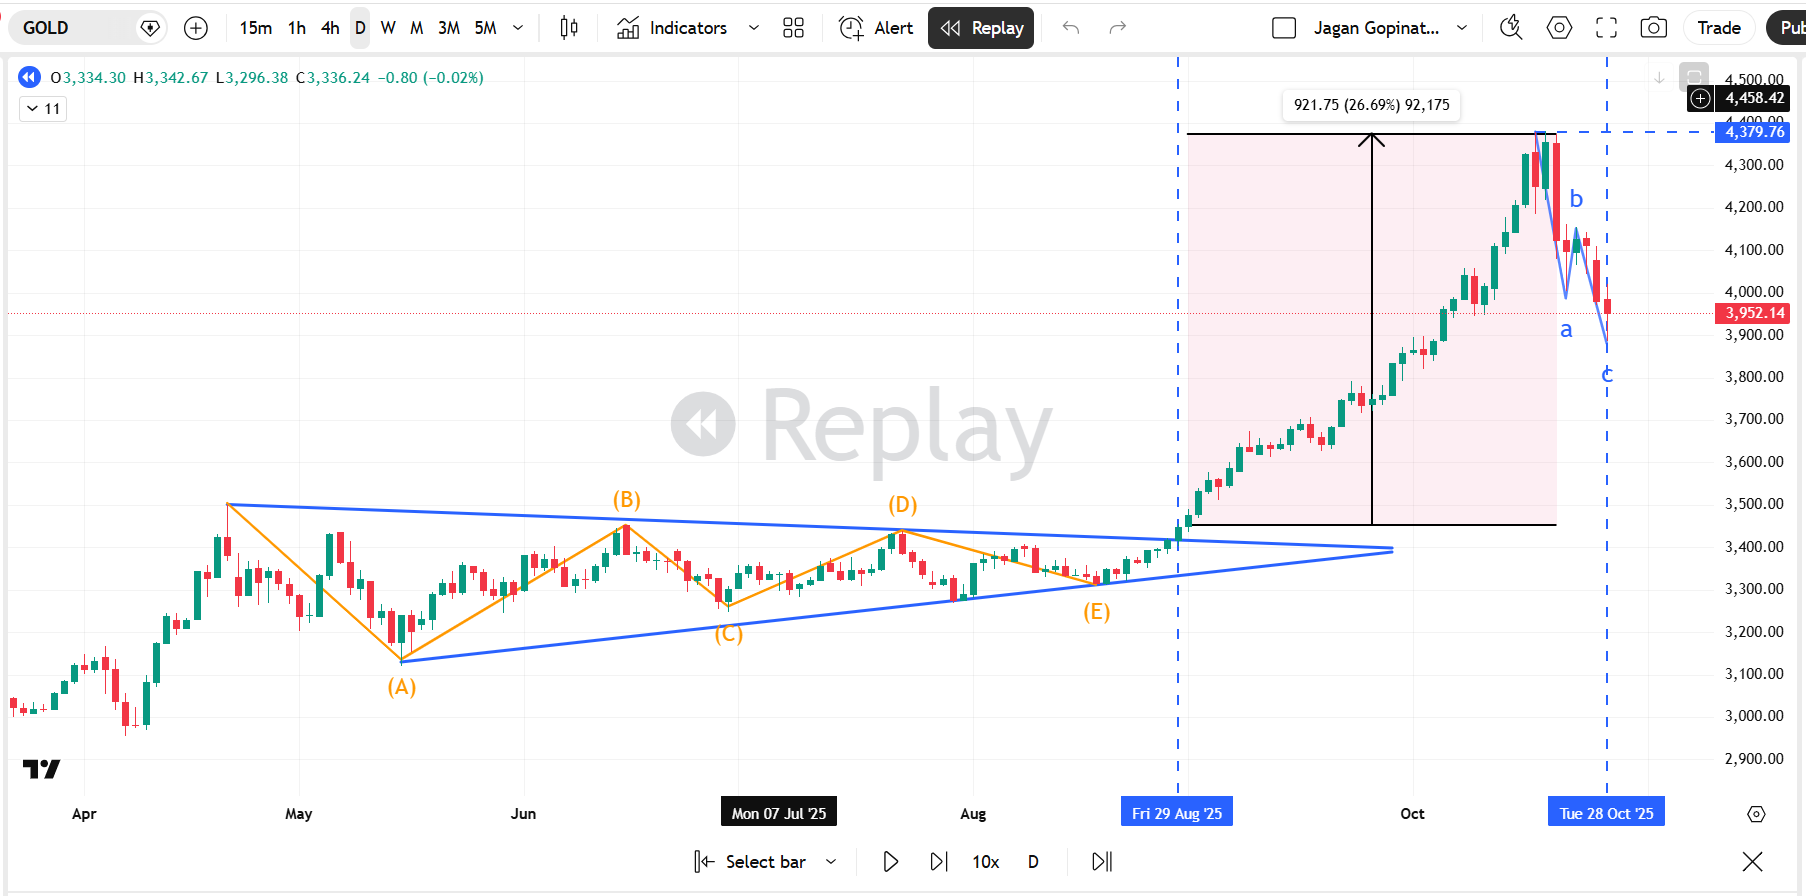
On 29th August 2025, we released an advisory to deploy capital into gold long positions, targeting not less than 30% annualised returns, with an exceptionally favourable risk–reward ratio of 1:8 (meaning for every unit of capital risked, the potential reward was eight times greater).
The thesis played out with precision. By late October 2025, gold had gained 27%, reaching $4,380 per ounce - surpassing our targeted risk-reward ratio, ahead of schedule. A healthy corrective phase followed, before gold resumed its upward journey, ultimately reaching $5,597 in January 2026.
Chart 5: Gold price behaviour — subsequent to our long entry recommendation
The Edge Lies in Integration
The analysis you have just read draws on four distinct pillars out of the five pillars in our framework - macroeconomic signals, fundamental demand drivers, structural market participation data, and technical analysis outputs. Each pillar, on its own, tells a partial story. It is their integration that transforms noise into signal.
This distinction matters enormously for investors. In today’s information-saturated environment, there is no shortage of analysis - macro commentary, technical analysis-based recommendations, and ETF flow reports are all freely available.
What is scarce is the discipline and expertise to weigh these signals against each other, to know when they confirm and when they conflict, and to act with conviction only when the evidence converges.
Applied in isolation - without the integrative lens and without expert guidance - each of these signals can be deeply misleading. A compelling chart pattern can fail. A bullish positioning report can precede a sharp correction. Acting on any single signal, without the context provided by the others, has historically led to significant erosion of investment capital. The framework works precisely because it refuses to let any single voice dominate the conversation.
A Note on Risk Management
Astute readers might have noticed that this report has focused on the investment thesis - the why and the when of the long gold trade we recommended.
What we have deliberately not covered in this first piece is the why and the when we recommended to exit the trade, and our recommendations on managing the risk. We target risk-adjusted alpha — not absolute alpha. We believe that risk mitigation measures should be in place before one deploys capital in search of alpha.
Futures and options offer powerful tools for protecting capital, defining downside, and enhancing the risk-reward profile of any trade. These instruments were an integral part of how we structured the investment exposure to gold - and they deserve a dedicated, thorough treatment of their own.
We have reserved that discussion for an upcoming report, where we will walk you through the risk management strategies we deployed, explain how we set price and time targets, and share the frameworks we use to size positions and protect capital. It is a topic we believe every serious investor needs to understand.
The Puzzle That Has Perplexed the Investment World
Gold has long been regarded as the ultimate hedge against geopolitical uncertainty. Yet since the outbreak of the Iran war on the 28th of February 2026, something unexpected has happened: instead of rising, gold has fallen.
For much of the investment world, this divergence has been deeply perplexing - a breakdown of a relationship that was considered almost axiomatic.
As data-driven professionals who understand the dynamic interplay between real yields, inflation expectations, and growth prospects, we are not surprised by the current behaviour of gold.
Our integrated framework has been closely tracking this divergence - monitoring the gap between geopolitical risk indicators and gold’s price behaviour, and building a view on what is driving it and where it leads. The signals we are seeing are, once again, telling a story that runs counter to the prevailing consensus.
We will be publishing our detailed analysis on this divergence very soon.
Upcoming — Risk Management Deep DiveHow we set price and time targets, size positions, and deploy futures and options to protect capital. Every serious investor needs to understand this.
Upcoming — Gold’s Geopolitical DivergenceWhy gold has fallen despite the Iran war outbreak — and what our integrated framework signals next. A story that runs counter to prevailing consensus.
Coming Soon — Silver & FXThe same integrated framework applied to silver and foreign exchange markets, with more agricultural commodity asset classes to follow.
Stay Ahead of the Curve — Subscribe
If this analysis resonated with you, we invite you to be part of what comes next.
We are in the process of formally launching our advisory firm, and this report is the beginning of a regular series spanning Gold, Silver, and Foreign Exchange - with more asset classes from the agricultural commodities basket to follow.
Each report will bring the same integrative rigour you have seen here: grounded in data, shaped by experience, and focused on delivering insight that goes well beyond the consensus.
Subscribe to Hedge$Pro today to receive our upcoming reports directly - including our analysis of gold’s perplexing divergence from geopolitical risk, our deep-dive into risk management using futures and options, and much more.
The signals are there - and we are here to help you navigate them.
This publication is for informational purposes only and does not constitute investment advice. Past performance is not indicative of future results. All market data and positioning figures cited are sourced from CFTC Commitments of Traders, CME Group, World Gold Council, and Bloomberg.