Brent Crude Oil – What Next After the US-Iran MoU?
Weekly Report · 23 June 2026 · Hedge$Pro
Introduction
For the first time since the West Asia conflict began, Brent crude September futures (CBU26) have fallen below the 200-day exponential moving average at 81.31 US dollars per barrel.
Figure 1: Daily chart of Brent crude September futures (CBU26), illustrating the key phases in its recent price movement.
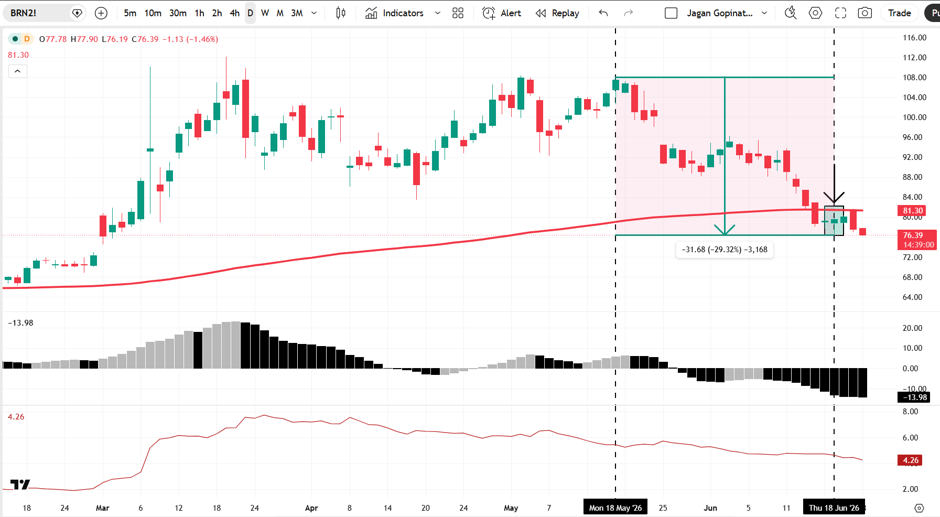
The momentum indicators in the daily and weekly charts continue to point downwards, though volatility has subsided.
The downward correction that began on 18 May has been accompanied by a steady increase in open interest (OI) from less than 290K to 521K (on 22 June). This indicates that, rather than long liquidation, fresh short positions have been the dominant driver behind the 30% correction from $108 to the current level of $77 in CBU26.
Fundamental Factors Behind the Decline
Expectations that the US and Iran are getting closer to a ceasefire deal.
The International Energy Agency’s (IEA) recent forecast that world oil consumption will decline by 1.1 million barrels per day (bpd) in 2026, compared to its previous estimate of 420,000 bpd.
The US Department of Energy (DoE) raised the US crude production estimate to 13.72 million bpd from the May estimate of 13.65 million bpd.
Strength in the US Dollar Index. Readers are encouraged to refer to “What Next for the US Dollar Index (DXY)” published on HedgesPro for a detailed assessment of the dollar’s trajectory.
The fall below the 200-day moving average, downward-pointing momentum indicators, and build-up of open interest alongside rising volume during the price decline create conditions that can make oil shorts overenthusiastic.
We caution oil shorts against overextending positions at current levels.
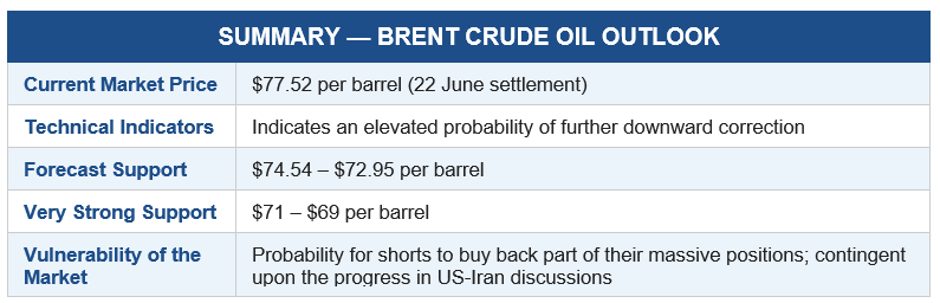
Rainflo’s forecasting models indicate strong support emerging in CBU26 in the price range of $74.54 and $72.95 per barrel, supported by both fundamental and technical reasoning.
The Technical Factors
Futures markets are forward-looking, discounting engines – price discovery evolves based on emerging expectations rather than current reality.
Since 18 May, expectation has been building in the market that the US and Iran could get closer to a ceasefire at any time. That expectation prompted oil bulls to liquidate their long positions to minimise their losses; and as the downward momentum gathered steam, it attracted fresh short positions in CBU26 futures.
Now that the MoU has been signed, the reality of the ceasefire has already matched the expectations of the shorts. Therefore, we believe that much of the bearish expectation has already been absorbed into current price levels.
Figure 2: Price action in CBU26 between 17 and 19 June 2026 (green shaded rectangular box) – a period that deserves close attention.
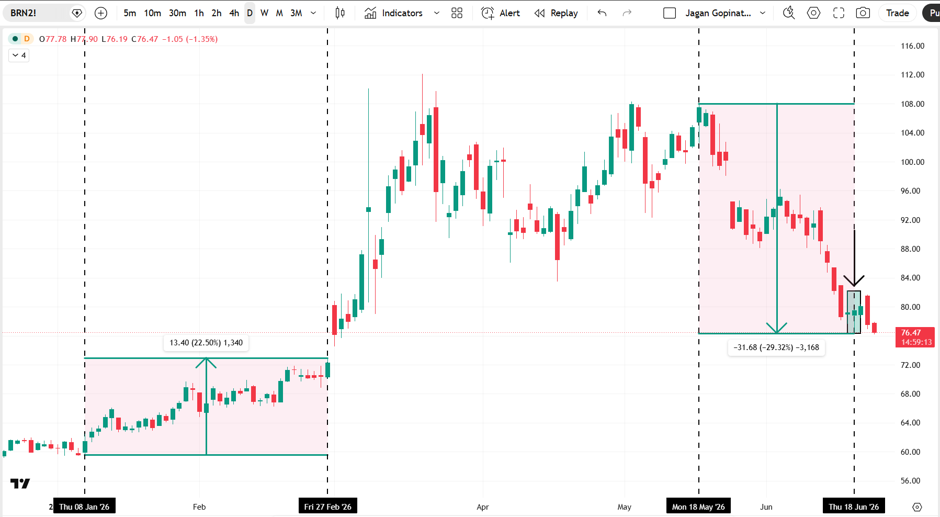
- The emergence of neutral candles and candles with long lower wicks during this period sent cautionary signals to oil shorts.
- During these three days, Iran threatened to walk out of the ceasefire deal following Israeli attacks on Lebanon. This episode underscores how quickly geopolitical developments can challenge the conviction behind a heavily positioned market.
- Large short positions become vulnerable to a short squeeze when the primary thesis driving the market lower comes under scrutiny due to the unpredictable behaviour of key actors.
- To the relief of short position holders, price subsequently moved lower following the US issuance of a 60-day licence on 22 June, permitting Iran to resume oil exports.
The Fundamental Factors
Despite the prevailing bearish sentiment, the following fundamental considerations underpin Rainflo’s forecast of CBU26 finding support between $74.54 and $72.95 per barrel.
We expect re-stocking demand to emerge as Brent crude approaches pre-war pricing levels. Major consuming nations have significantly drawn down strategic reserves during the conflict and are unlikely to forgo the opportunity to rebuild inventory when supply conditions permit.
Pre-war Pricing Reference
By the time the West Asia conflict began on 28 February 2026, Brent crude had already risen above $70 per barrel in anticipation of hostilities. We therefore use $70 as the pre-war pricing level for modelling purposes.
One could argue that the pre-war pricing level was in the lower $60 range, and that oil shorts may attempt to push prices toward the $60 level following the ceasefire. (Refer to the 8 January pricing point marked in Figure 2.) However, the destruction of oil production and refining facilities during the conflict is a material consideration. Analysts estimate that normalisation of upstream oil production in the Persian Gulf could take weeks, if not months. This underpins our modelling output, which places the structural floor for Brent crude at $70 and above.
Signals from the Options Market
Figure 3: Open interest plotted against strike prices in CBU26 Put Options, revealing where the market has concentrated its defensive positioning.
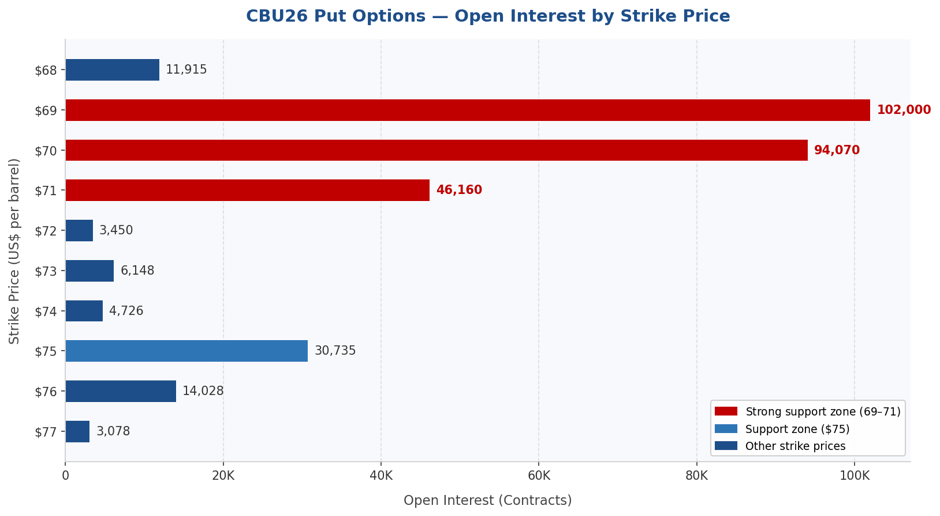
The options market signals underlying support at $75 per barrel, with significantly stronger demand concentration in the $71 to $69 range, consistent with Rainflo’s forecast support levels.
Concluding Remarks
What Next for your Business?
If your business carries exposure to oil price volatility and you are evaluating hedging options, Rainflo Consulting LLP offers structured risk management solutions tailored to your specific exposure profile. We would welcome the opportunity to connect and design a framework using Futures and Options instruments available on MCX for Indian market participants and on overseas exchanges for international participants.
A Note for Textile Industry Participants:
Cotton price discovery does not occur in isolation. The US Dollar Index shapes the broader commodity pricing environment, while Brent Crude influences input costs across the textile value chain. A clear read on both is therefore a prerequisite for forming well-grounded views on cotton futures and for structuring effective risk management solutions. Rainflo’s perspectives on the US Dollar Index and Brent Crude Oil are available on www.hedgespro.com and are essential reading for textile industry participants navigating cotton price risk.
Copyright
© 2026 Jagan Gopinath. All rights reserved. No part of this publication may be reproduced, distributed, or transmitted without prior written permission.
Disclaimer
This report is provided for informational and educational purposes only and does not constitute investment, trading, or financial advice. Readers are solely responsible for their decisions. Rainflo Consulting LLP, the platform provider Statoberry LLP and the author accept no liability for any loss arising from the use of this report.