US Dollar Index Outlook: Can Treasury Inflows Offset BoJ Intervention Risk
Weekly Report · 01 July 2026 · Hedge$Pro
At the time of publication of “What Next for the US Dollar Index (DXY)” on 21 June in HedgesPro, (based on the DXY settlement level of 100.82 on 19 June), Rainflo’s predictive model indicated that the index could advance towards 101.95 region in the near term, where significant resistance was expected.
The DXY subsequently reached an intraday high of 101.81 on 24 June, coming within 0.14 points of the projected resistance level, before retracing 0.76% to 101.04. While a single instance does not establish the long-term performance of a forecasting framework, the price action during this period was broadly consistent with the projected resistance zone.
In the 21 June report, we argued that continued inflows into the US equity market were likely to provide support for the DXY, keeping it above the 99.30 level. Since the publication of the report, the index has remained above this support level, consistent with that assessment.
However, both US equity market and US treasury markets have experienced periods of heightened volatility since the report was published, developments that were not incorporated into our earlier analysis. Examining the drivers of these market movements is important for assessing whether the underlying assumptions of our previous outlook remain valid and for forming an updated view on the trajectory of the DXY.
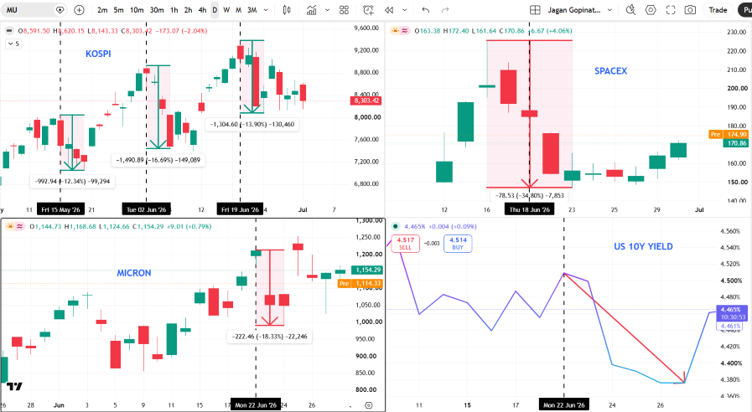
Top Left Quadrant: KOSPI (South Korea’s Benchmark Equity Index)
The KOSPI declined by 13.90% between 22 and 23 June amid heightened concerns over AI related valuations, sentiment that also weighed on US technology stocks, particularly those within the Nasdaq index. The subsequent stabilization in the KOSPI suggests that the sell off was relatively short lived. This pattern is consistent with two earlier corrections during the current rally, when the index declined by 12.34% around 15 May and 16.69% around 2 June, before recovering within a short period. These recurring episodes indicate that sharp pullbacks have thus far represented temporary corrections rather than a sustained deterioration in market sentiment.
Rainflo has examined the structural drivers of the current AI investment cycle in a separate report, including why we believe it differs from technology bubbles of previous decades.
Top Right Quadrant: SpaceX IPO
SpaceX experienced a sharp post IPO repricing during the same period of heightened volatility observed across global technology equities. The initial trading phase was characterized by elevated price fluctuations as the market absorbed a combination of large-scale index inclusion inflows and reassessment of valuation levels in the context of its governance structure, including its dual class share framework and concentrated control. This adjustment in SpaceX’s valuation coincided with weakness in other high growth technology markets, including the KOSPI and US AI linked equities, suggesting a broader period of rotation within global risk assets.
Bottom Left Quadrant: Micron Technology
Micron’s share price declined by approximately 18% following the broader technology sell off that began on 22 June. However, the company subsequently recovered much of those losses after reporting quarterly results that exceeded market expectations and reinforced confidence in continued AI driven demand for high bandwidth memory and data centre infrastructure. The rebound suggests that while market sentiment became more cautious toward AI related equities, investors continued to differentiate between valuation driven corrections and companies supported by strong fundamentals.
Bottom Right Quadrant: US 10 Year Treasury Yield
In the 21 June report, we identified continued foreign inflows into US equities as an important factor supporting the DXY. However, the DXY remained resilient following the subsequent equity market correction. As risk sentiment deteriorated, investors increased allocations to US treasuries, driving treasury prices higher. Because bond prices and yields move inversely, the yield on the 10-year treasury declined from 4.513% on 22 June to 4.361% on 30 June. This flight to safety dynamic sustained demand for US dollar even as equity inflows moderated, contributing to the resilience of DXY despite temporary weakness in US equities.
DXY Framework Update (Headwinds and Tailwinds):
We now reassess the headwind and tailwind factors for the DXY identified in the 21 June report.
Tailwinds:
We had identified equity inflows as the primary tailwind supporting the dollar. We now incorporate US treasury inflows as an additional tailwind factor.
Recent US job market data, including job openings of 7.6 million in May versus expectations of 7.3 million, is consistent with resilience in labour market conditions and supports risk appetite and continued capital flow into US assets.
Near term fluctuations in oil prices, including those driven by improvements in tanker flows through the Strait of Hormuz, are unlikely to materially affect medium term inflation expectations, which tend to be anchored by a broader set of structural factors beyond short term energy price movements.
Real yields have remained supported in the context of resilient growth conditions and sustained strength in risky assets, suggesting that upward pressure on US treasury yields may persist even in the absence of significant inflation surprises. If equity concerns re-emerge, particularly in the context of AI related market volatility, fixed income is likely to retain its role as a hedge against equity drawdowns. In such a scenario, US treasuries would act both as a portfolio stabiliser and an additional support factor for the US dollar.
Headwinds:
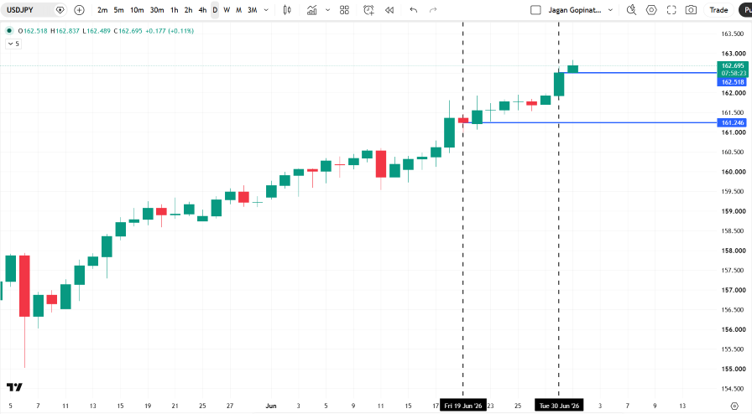
We had highlighted potential intervention by the Bank of Japan as a key headwind for the US Dollar Index in the 21 June report. Since then, the JPY has weakened from 161.246 to 162.518, modestly increasing the probability of intervention by BoJ.
Historical patterns suggest that Japanese FX intervention tends to occur in short clustered episodes, often under conditions of reduced market liquidity. Recent communications from Japanese authorities, combined with past intervention behaviour, indicate a preference for targeting periods where market impact can be amplified without triggering sustained dislocation in USD/JPY markets.
Against this backdrop, we continue to view BoJ intervention as a relevant but contained headwind for the US Dollar Index. While the risk of intervention has increased modestly with further JPY intervention, the impact of intervention is likely to remain episodic rather than directional in nature, and therefore insufficient to materially alter the broader DXY trend.
Concluding Remarks:
Near-term Outlook:
On 1st July, speaking at the European Central Bank forum on Central Banking held at Sintra, Portugal, Federal Reserve Chair Kevin Warsh reiterated US central bank’s commitment to its 2% inflation objective, underscoring the continued focus on maintaining price stability within the existing policy framework.
Against this backdrop of consistent policy signalling, and based on analysis of recent cross-asset developments outlined in this report, Rainflo estimates that the US dollar index is likely to be well supported at the 100.85 level, with near term resistance seen around 101.82.
Positioning indicators in DXY also suggest that open interest is stabilising alongside moderating momentum and declining volatility, consistent with a market environment characterised by consolidation rather than renewed trend extension.
Medium-term Outlook:
We retain the medium-term outlook presented in the 21 June report that the US dollar index is likely to remain supported by continued strength in US equity markets. We now augment this framework by incorporating capital flows into US treasuries as an additional source of support during periods of heightened market uncertainty.
Accordingly, we expect DXY to trade within a broad range of 99.50 to 101.95 over the medium term, with a bias towards the upper end of that range.
Longer-term Outlook:
As outlined in the 21 June report, the probability of further Federal Reserve policy tightening is expected to diminish if the US-Iran ceasefire holds and lower energy prices continue to ease inflationary pressures.
Unless the index decisively breaks below the critical support level of 97.592, we do not consider the prevailing bullish trend to have transitioned into bearish.
What Next for your Business?
If your business has exposure to foreign exchange risk, Rainflo Consulting LLP offers quantitative risk management solutions designed to help organizations measure and hedge currency exposures effectively.
We would be pleased to discuss your specific requirements and develop a bespoke risk management framework tailored to your business objectives.
Copyright
© 2026 Jagan Gopinath. All rights reserved. No part of this publication may be reproduced, distributed, or transmitted without prior written permission.
Disclaimer
This report is provided for informational and educational purposes only and does not constitute investment, trading, or financial advice. Readers are solely responsible for their decisions. Rainflo Consulting LLP, the platform provider Statoberry LLP and the author accept no liability for any loss arising from the use of this report.