Cotton’s Next Move: Can El Niño’s Supply Threat Overcome the U.S. Dollar Headwind?
Weekly Report · 09 July 2026 · Hedge$Pro
1. Introduction:
In the market note circulated to stakeholders from the textile and cotton industry during the trading session on 24 June, I highlighted that December cotton futures will remain rangebound between 76.11 cents per pound and 80.47 cents per pound in the near term.
Since then, December cotton futures have largely respected the identified resistance and support levels, except for a technical breakout on 7 July that lifted cotton futures beyond 80.47 cents to settle at 81.29 cents per pound.
As emphasized in my previous notes, the forecasted price levels are not magical turning points. No consulting firm possesses a crystal ball capable of forecasting financial markets with certainty. The importance of such levels lies not in the number itself, but in deciphering the market context surrounding it: assigning appropriate weight to the probable causes directing a price move, and evaluating the potential consequences if a key level is decisively breached.
More importantly, if that anticipated scenario materialises, are you, as a cotton producer or cotton consumer, exposed to the resulting price risk? If the answer is yes, one should be prudent enough to mitigate the risks through an appropriate hedging strategy.
2. The December Cotton Futures Breakout on 7 July: The Hourly Chart
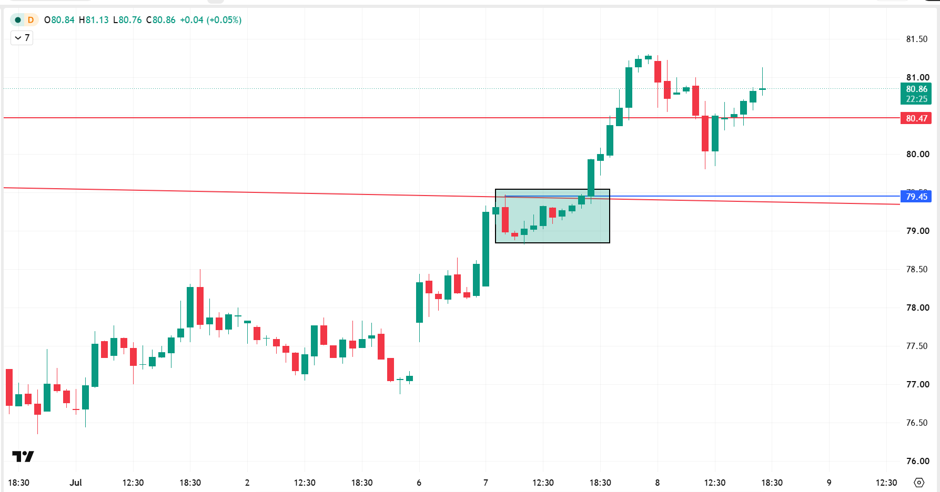
What attracted the flow of significant capital on 7 July, during the early European session (around 9:00 AM IST/5:30 AM CET) to December cotton futures?
2.1. Cotton’s Relative Risk-Reward Profile Within the Soft Commodity Complex:
The recent repricing in ICE coffee September futures and ICE cocoa September futures provides important context for understanding the breakout in December cotton futures on 7 July.
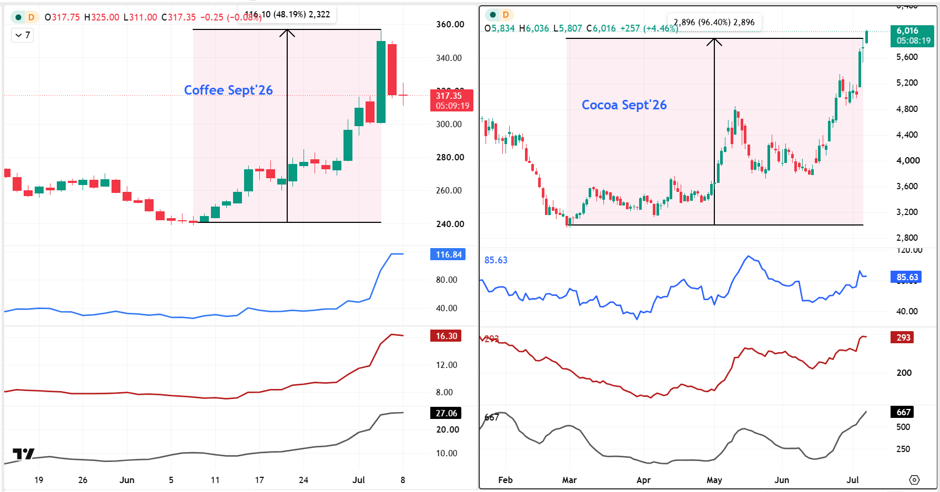
Institutional investors do not allocate capital solely to the commodity with the strongest fundamental narrative. They allocate capital to the opportunity offering the most attractive balance between expected return and portfolio risk.
By early July, coffee futures and cocoa futures had delivered exceptional weather-driven rallies of approximately 48% and 96% respectively. As prices accelerated higher, daily price ranges expanded significantly, and maintaining exposure required a larger allocation of portfolio risk capital.
The options market reflected this rising uncertainty. The most actively traded September coffee contract implied annualised volatility of 56.55%, while the corresponding September cocoa contract implied annualised volatility of 54.48%.
For institutional investors operating under volatility-targeting mandates, such volatility levels have direct implications for position sizing and capital allocation. As realised and expected volatility rise, existing positions consume a larger share of the portfolio’s risk budget. Consequently, fund managers may reduce exposure to highly volatile assets - not necessarily because their fundamental outlook has changed, but because those positions have become significantly more expensive from a portfolio risk perspective.
This created a relative value opportunity in cotton.
Before the 2.99 cents rally on 7 July, implied volatility in December cotton futures remained below 21%. For institutional investors seeking exposure to weather sensitive agricultural commodities, cotton offered an attractive risk-reward profile: participation in a potential supply driven rally without assuming the same level of volatility risk in commodities such as coffee and cocoa.
As December futures advanced, the options market repriced future uncertainty, with implied volatility rising from below 21% to 24.16% on 7 July and then dropping marginally to 23.86% on 8 July.
2.2. Positioning Before the Breakout – Since 30 June:
Unlike the relatively stable positioning observed between 16 June and 30 June – a period during which open interest remained relatively flat, after 30 June, the price action was increasingly accompanied by expanding open interest, indicating that new capital was entering the cotton futures market rather than existing participants adjusting positions.
This shift became particularly evident on 7 July, when December cotton futures recorded an increase of 2864 contracts in open interest, while total open interest across all cotton futures contracts rose by 7,391 contracts.
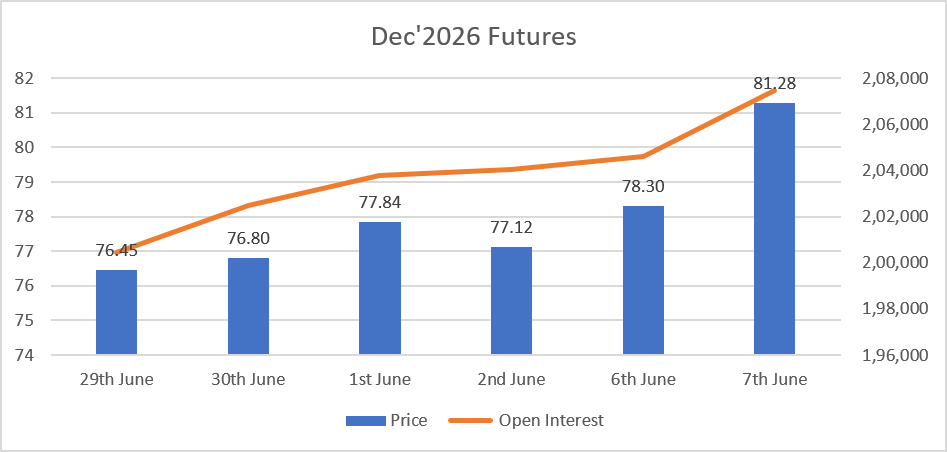
Viewed alongside the decisive price breakout above 80.47 cents per pound and the concurrent repricing of implied volatility, the expansion in open interest provides additional evidence that institutional participation in December cotton futures strengthened since the end of June.
3. Convergence of Factors:
The strengthening of market participation in December cotton futures reflects the convergence of three complementary drivers: relative capital allocation within the agricultural commodities complex, a decisive technical breakout above a long-term resistance level, and growing recognition of supply side risks affecting global cotton production in key origins such as USA, China and India.
3.1. United States: Rising Weather Risks
The deterioration in U.S. crop conditions has increased markets sensitivity to weather developments, with Texas emerging as primary area of concern.
Between 14th June and 5th July, Texas’ crop condition index declined from 334 to 310, representing a deterioration of 24 index points over three weeks. As a broad guideline, a reading in the 330 – 350 range is generally associated with average crop conditions, while levels below 320 suggest noticeable deterioration. Readings below 300 typically reflect significant crop stress.
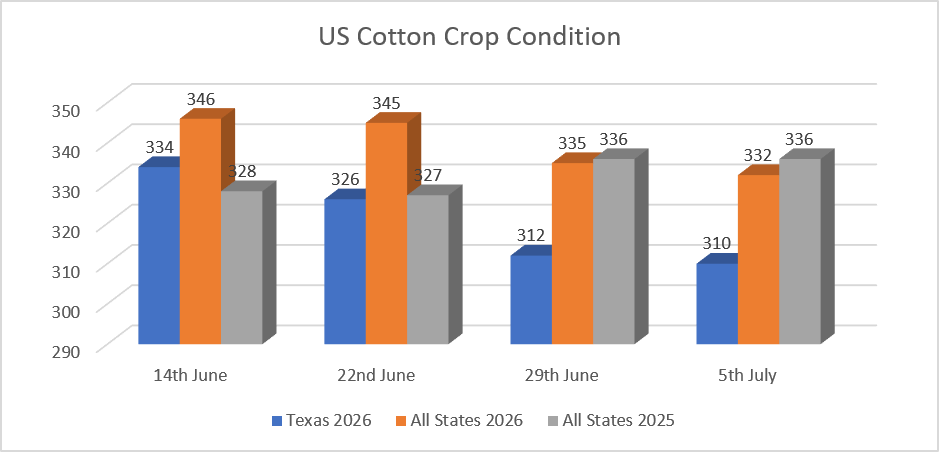
By contrast, the overall U.S. crop condition declined more modestly, from 346 to 332, a reduction of 14 points over the same period. While national crop conditions had remained broadly in line with last year’s levels through much of June, the 5 July reading of 332 marked the first weekly observation this season below the corresponding 2025 level of 336.
For the cotton market, the significance of the deterioration in Texas is not that it confirms lower US production. Rather, it increases the probability of downward revisions to both yield expectations and harvested acreage, should adverse weather persist during the crop’s critical development phase.
Temperature and Precipitation Forecasts from United States:
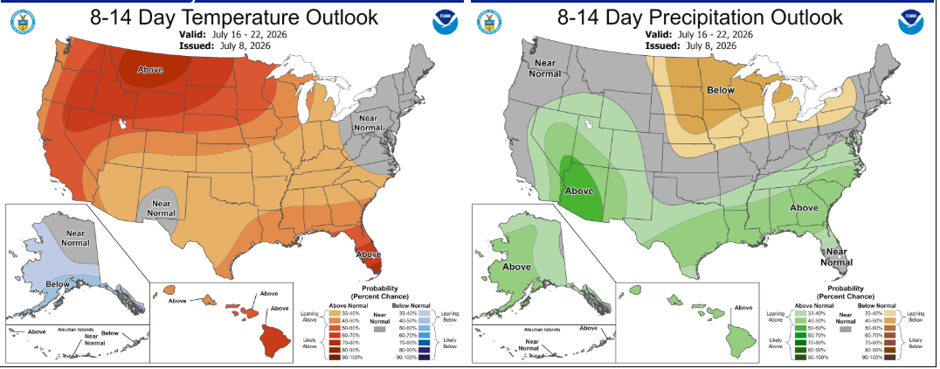
The latest 8-14 day temperature outlook indicates a continued probability of above normal temperatures across several major cotton producing regions, including parts of Texas and the Southern United States.
The precipitation outlook provides a more balanced picture. While above normal rainfall is forecast across much of the Southern plains and Southeast United States, portions of the northern cotton belt are expected to receive below normal precipitation. The anticipated rainfall may alleviate moisture stress in parts of Texas and neighbouring production regions, although the extent to which it offsets the impact of persistent high temperatures will depend on both the timing and distribution of rainfall.
Consequently, the current outlook does not point to either a definitive improvement or deterioration in U.S. cotton production prospects. Instead, it suggests that weather risk is likely to remain elevated, with market attention focussed on whether the forecast rainfall is sufficient to stabilize crop conditions in Texas during the remainder of July.
3.2. China:
China’s cotton market presents a combination of rising production uncertainty and potential demand support through imports.
During the first week of July, Xinjiang – China’s major cotton producing region, experienced a period of significant heat stress. With the 2026 cotton crop entering the critical flowering and boll formation stages, the duration and intensity of elevated temperatures have become important determinants of final yield and fibre quality outcomes.
The significance of this weather risk is amplified by a lower production base. According to the National Cotton Market Monitoring System, China’s 2026 cotton planted area declined to 46.32 million mu, representing a year-on-year reduction of 1.458 million mu or 3.1% overall. Within this total, Xinjiang’s planted area declined by 3.4% compared with the previous year.
For the cotton market, the key implication is not necessarily an immediate production loss, but the increased probability of downward revisions to yield expectations at a stage when the crop remains vulnerable to adverse weather conditions.
While weather related risks are increasing uncertainty around Chinese domestic production, the relative pricing relationship between ZCE futures and ICE futures remains supportive of potential import demand, provided policy constraints do not restrict import flows.
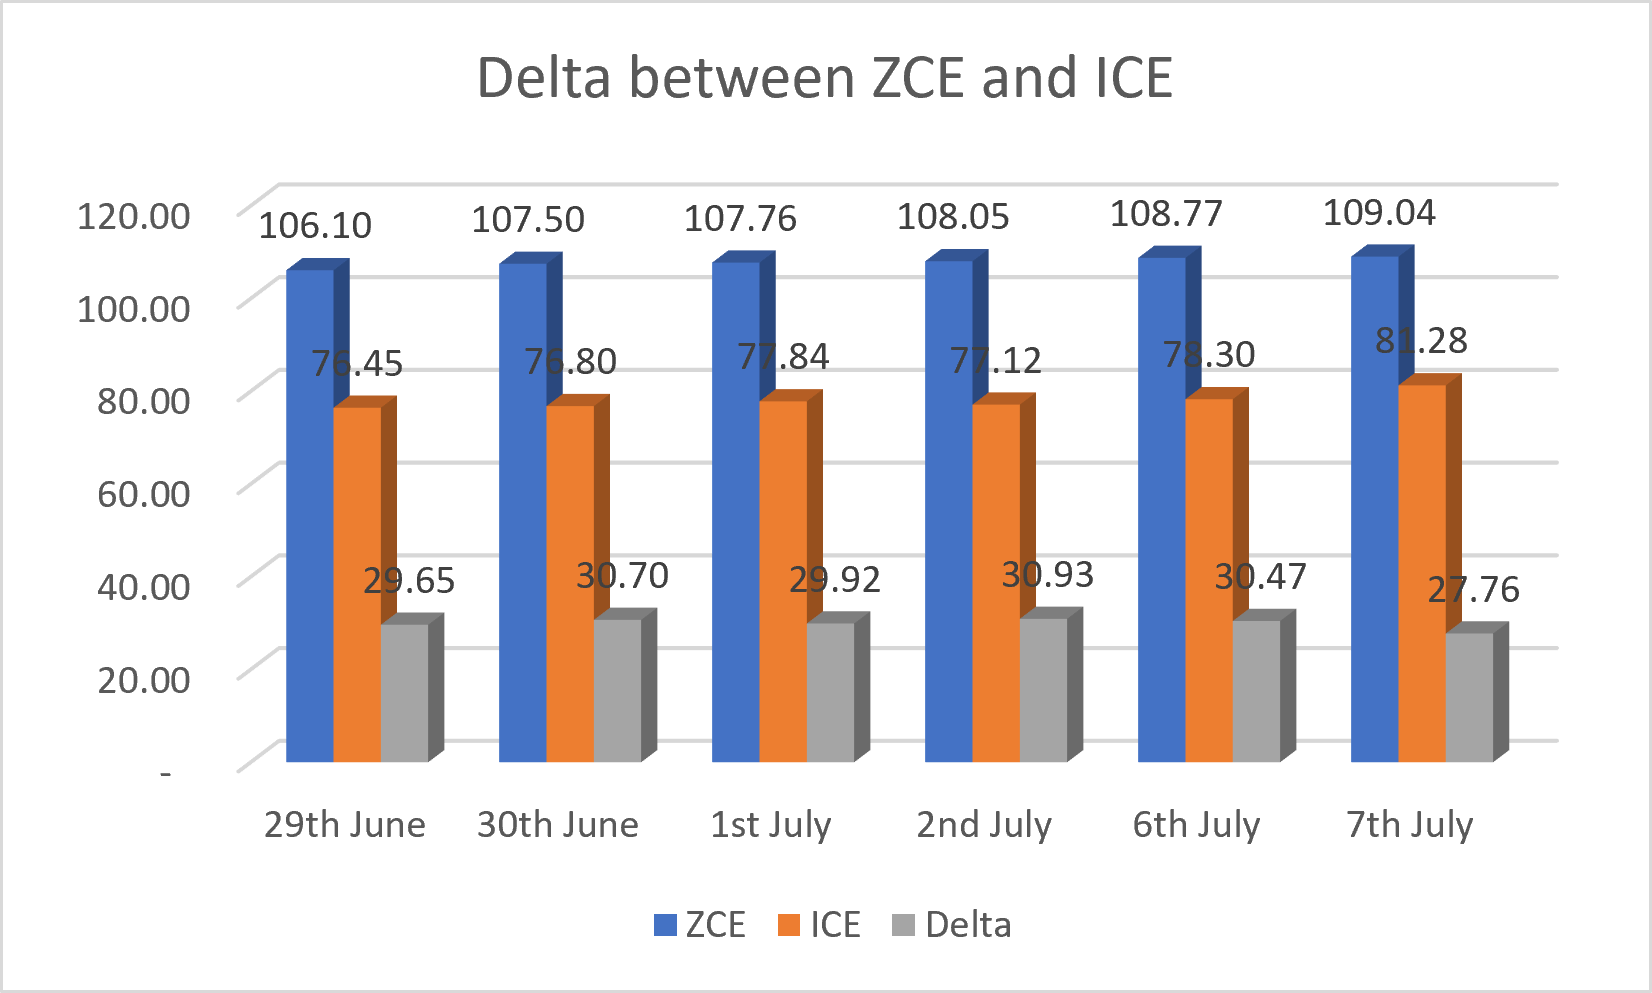
However, the magnitude and timing of the Chinese import demand remain difficult to assess due to:
Uncertainty surrounding the timing and volume of potential releases from China’s strategic cotton reserves
Allocation and availability of import quotas in China
The possibility of cotton featuring prominently in upcoming US-China trade discussions
Recent diplomatic developments have attracted market attention towards the third factor. On 1 July, China’s Ministry of Commerce announced that the two countries had agreed in principle to include agricultural products within a reciprocal tariff reduction framework. The statement followed discussions on 30 June between China’s Foreign Minister and the US Secretary of State, indicating continued progress in broader trade negotiations.
China’s purchases of U.S. Soyabeans during the first week of July have further reinforced these expectations, with market sources reporting that state owned grain trader COFCO booked five additional soyabean cargoes for September and October shipment. Whether Cotton will feature in the broader agricultural package announced by United States remains uncertain. Nevertheless, market participants increasingly view cotton as a potential component of future trade discussions.
3.3. India: A Complex Supply Side Risk
Unlike China, where the primary uncertainty relates to yield and quality outcomes on an already reduced acreage base, India presents a different supply side challenge. The uncertainty in India lies in determining the final planted area and whether any potential increase in acreage can offset the impact of delayed sowing and a compressed crop development window.
3.3.1. El Niño, Monsoon Progression, and Crop Development Risk:
The strengthening El Niño conditions have introduced a significant layer of uncertainty to India’s cotton crop outlook. Sea surface temperature anomalies in the Nino 3.4 region increased from +0.48°C during March-May 2026 to +1.7°C by 17 June, indicating that Pacific Ocean conditions have transitioned into El Niño conditions and are intensifying towards a moderate strength event.
Concerns regarding the impact of El Niño were amplified by the weak start to the 2026 monsoon season. June rainfall totalled only 99.5 millimetres, making it the fifth driest June in over a century.
Although rainfall recovered in July, with the national deficit narrowing to approximately 20% of the long period average (LPA) as of 6 July, the timing and spatial distribution of rainfall remain more important determinants of crop development than the monthly rainfall aggregate.
3.3.2. Regional Variations Complicate the Production Outlook:
India cannot be analysed as a single homogenous cotton growing region. The impact of weather conditions varies significantly across producing states depending on irrigation availability, reservoir storage and local agronomic factors.
According to Central Water Commission data as of 2 July, the western region, which includes the important cotton growing states of Gujarat and Maharashtra, had live storage of 10.792 BCM across 53 monitored reservoirs, equivalent to 28.33% of total live storage capacity. This compares with 43.90% during the corresponding period in 2025.
However, state level conditions provide a more nuanced picture. The Sardar Sarovar Dam, a critical source of irrigation support in Gujarat, had live storage of 2,474 MCM against a storage capacity of 5,860 MCM as of 8 July, equivalent to approximately 42% of capacity.Recent rainfall across several regions in Gujarat is expected to improve soil moisture conditions and contribute to additional reservoir inflows.
At the same time, several cotton growing districts in Maharashtra continue to experience heat stress. The IMD weather forecasts for the period 9 July – 15 July indicate fairly widespread rainfall across Vidarbha, scattered to fairly widespread rainfall across Marathwada, and comparatively limited rainfall across Madhya Maharashtra. Therefore, aggregate monsoon indicators alone may not adequately represent the evolving production risks across India’s diverse cotton growing regions.
3.3.3. Acreage Recovery Versus Late Sowing Risk:
The delayed and uneven monsoon progression has already influenced farmer planting decisions during the Kharif season. The impact has been particularly visible in oil seeds, with soyabean acreage declining by approximately 40% to 4.8 million hectares.
Since soyabean is a key competing crop in farmer acreage decisions, the closing of its optimal sowing window could create an opportunity for cotton acreage recovery. However, any potential increase in cotton acreage needs to be evaluated alongside the impact of delayed sowing.
Although cotton has a relatively wider sowing window compared with several competing Kharif crops, late planting reduces the crop development period and increases vulnerability to adverse weather conditions during later stages of the crop cycle.
Therefore, the key question for the cotton market is not simply whether cotton acreage can recover, but whether additional planted area will be sufficient to offset the potential impact of delayed sowing on yield and fibre quality.
3.3.4. The IOD Factor: A Potential Offset to El Niño Risk
While El Niño forecasts have increased uncertainty around India’s cotton production outlook, historical experience suggests that El Niño should not be analysed in isolation.
The 2015 season provides an important reference point. Despite the occurrence of a strong El Niño event, a positive Indian Ocean Dipole (IOD) phase moderated the adverse impact of El Niño on the Indian monsoon.
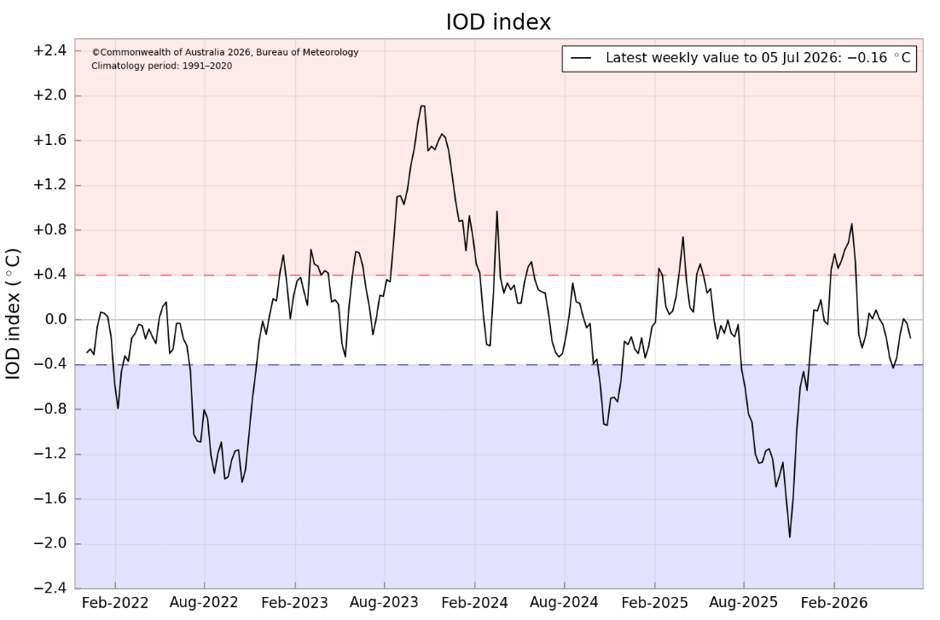
The optimism surrounding a possible transition towards a positive IOD phase in 2026 appears to be influenced by the recent improvement in index readings. The weekly IOD index improved from -0.34°C on 7 June to -0.16°C on 5 July, indicating a gradual movement towards neutral territory.
However, the index remains in negative territory and has not yet transitioned into a positive phase. While further improvement in the IOD index could provide a potential offset to El Niño related risks, such an impact should not be assumed until supported by a sustained positive IOD signal.
3.3.5. Implications for Global Cotton Trade:
India occupies a critical position in the global cotton supply chain. The country exports approximately 25% to 35% of its annual cotton production in the form of yarn to major consuming countries such as China and Bangladesh, in addition to exports of raw cotton lint.
Any meaningful reduction in Indian cotton production or fibre quality could reduce export availability, forcing major consuming markets such as China and Bangladesh to secure a larger share of their import requirements from international markets. Should a significant portion of that incremental demand be met by the United States, the resulting increase in U.S. exports would tighten the U.S. cotton balance sheet and provide an additional tailwind to ICE Cotton futures.
4. The U.S. Dollar Headwind:
The supply side risks discussed above represent potential support for cotton prices; however, not all bullish developments will necessarily translate into higher ICE Cotton futures. For example, India could potentially achieve acreage recovery and higher production volumes, while adverse weather degrades the fibre quality. In such a scenario, fine count spinners requiring tighter cotton quality specifications may seek specific qualities from alternative origins, resulting in stronger basis levels and quality premiums without necessarily creating sufficient supply tightness to drive ICE futures significantly higher.
The key question for cotton futures is therefore whether these emerging supply side risks can generate sufficient conviction among market participants to offset the headwind from the U.S. Dollar.
In my previous analysis published on Rainflo’s hedge intelligence platform HedgesPro on 21 June, https://www.hedgespro.com/USD/2026-06-21-what-next-for-the-dxy.html, I had highlighted that the DXY was likely to find support near the 99.30 level, while facing resistance near 101.95. Subsequently in the 1 July update in HedgesPro https://www.hedgespro.com/USD/2026-07-01-DYX.html the projected resistance level was marginally revised lower to 101.82, whole the support level was adjusted higher to 100.85.
The subsequent movement in the DXY demonstrated the forecasting efficiency of Rainflo’s framework, with the market respecting the identified support and resistance zones despite the evolving macro developments. The accompanying chart illustrates the accuracy of these technical reference points.
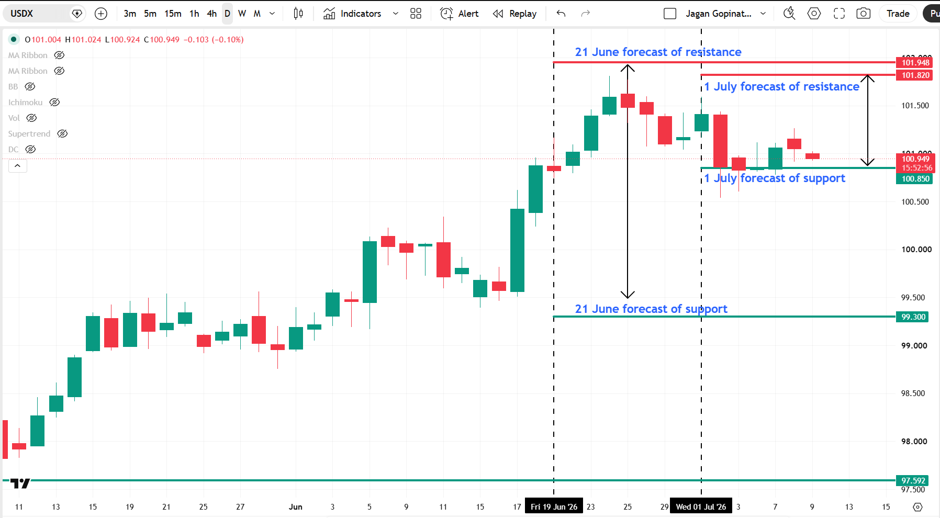
With the resumption of hostilities between the Unted States and Iran, geopolitical risk premium could provide additional support to the U.S. Dollar Index. At the same time, the possibility of further intervention by the Bank of Japan remains a key risk to dollar strength. The Bank of Japan’s intervention on 2 July weakened the DXY; however, the index remained supported near the 100.85 level identified in Rainflo’s analysis.
Market expectations suggest that any further intervention by Bank of Japan is more likely to be targeted closer to the mid-July holiday period in Japan. While such intervention could create short term volatility, the downside risk to the dollar index may remain limited if geopolitical tensions continue to escalate.
4.1. Implications for Cotton Demand:
A stronger U.S. Dollar presents a direct headwind for cotton demand by increasing the cost of imported cotton for overseas buyers. At the same time, higher Brent crude prices resulting from geopolitical risk could increase operating costs for textile mills through higher energy and transportation expenses.
Therefore, the combination of elevated energy costs and a stronger dollar could pressure global textile margins and weigh on global cotton consumption.
5. Weighing the Tailwinds against the Headwinds:
In the United States, deteriorating crop conditions in Texas have increased weather related production risk, although the improving rainfall outlook could partially mitigate the weather risks.
In China, weather conditions have increased uncertainty around production prospects, although the extensive irrigation infrastructure in Xinjiang is expected to mitigate much of the impact from daytime heat stress. The more important variables in the Chinese market are policy-related, especially the timing of strategic reserve sales, the allocation of import quotas, and the progress of US-China trade negotiations.
India presents a different challenge. While delayed monsoon conditions could ultimately support cotton acreage at the expense of competing crops such as soyabean, the more important uncertainty is whether delayed sowing and evolving weather conditions will affect yield and fibre quality. The evolution of Indian Ocean Dipole will therefore remain an important variable to monitor during the remainder of the monsoon season.
Taken together, these supply side developments represent potential tailwinds. By contrast, the principal headwinds are already evident. A firm DXY continues to keep the cost of imported cotton elevated for consuming countries, while the recent recovery in crude oil pricing is increasing operating costs across the textile value chain.
Should the situation in West Asia escalate further, sustained strength in energy prices could reinforce inflationary pressures, increasing the likelihood that the U.S. Federal Reserve maintains a restrictive monetary policy stance. The resulting pressure on consumer purchasing power would weigh on discretionary spending, creating an additional headwind for global textile demand.
6. What Next for December Cotton Futures?
From a technical perspective, December cotton futures continue to exhibit constructive price action. Momentum indicators remain positively aligned, while prices are trading comfortably above the 50-day, 100-day, and 200-day exponential moving averages (EMAs) reflecting a market that has strengthened meaningfully in recent days.
However, Rainflo’s analytical framework does not rely on technical indicators in isolation. While the technical backdrop has undoubtably improved, our assessment assigns greater weight to the evolving contest between the supply side tailwinds and the macroeconomic headwinds discussed earlier. At present, neither side has established sufficiently convincing dominance to justify a departure from the outlook published on 24 June.
Accordingly, we continue to expect December cotton futures to remain range bound between 76.11 and 80.47 cents per pound in the near future, albeit with an upward bias, until either the tailwind or headwind factors decisively overwhelm the other.
Between the strike price of 80 cents and 85 cents in December cotton futures, ~ 4 million bales of call options have been sold. They represent an additional layer of resistance; we therefore continue to regard 80.47 cents per pound as the level that must be convincingly breached before concluding that December cotton futures have entered a sustained bullish phase.
Conversely, a decisive break below 76.11 cents per pound would indicate that bearish forces have regained control of the market.
7. Concluding Remarks:
For participants across the cotton value chain, the key challenge is not simply forecasting market direction, but deciding when and how to manage price risk.
Should cotton be bought or sold now, or should the decision be deferred?
Should contracts be concluded on a flat price basis or on-call?
For existing on call contracts, is this the right time to fix prices, or is it prudent to wait?
Should the price risk be mitigated using only the futures markets or through a combination of futures and options strategies?
As this report demonstrates, commodity markets are influenced by multiple, often competing forces. Effective risk management therefore requires continuous assessment of evolving market conditions rather than reliance on static market views.
Rainflo Consulting LLP supports market participants through three complementary service streams: Rainflo Analytics, which provides market intelligence; Rainflo Advisory, which develops bespoke hedging and commodity price risk management strategies; and Rainflo Academy, which delivers training programs to strengthen market analysis and risk management capabilities.
If your organisation is seeking support in developing market views or for managing cotton price risk, we would be pleased to discuss how Rainflo can help.
Copyright
© 2026 Jagan Gopinath. All rights reserved. No part of this publication may be reproduced, distributed, or transmitted without prior written permission.
Disclaimer
This report is provided for informational and educational purposes only and does not constitute investment, trading, or financial advice. Readers are solely responsible for their decisions. Rainflo Consulting LLP, the platform provider Statoberry LLP and the author accept no liability for any loss arising from the use of this report.